• Published on: Jan 23, 2022
  • 3 minute read
  • By: Second Medic Expert

Diagnostics: Kidney Function Test

  • WhatsApp share link icon
  • copy & share link icon
  • twitter share link icon
  • facebook share link icon

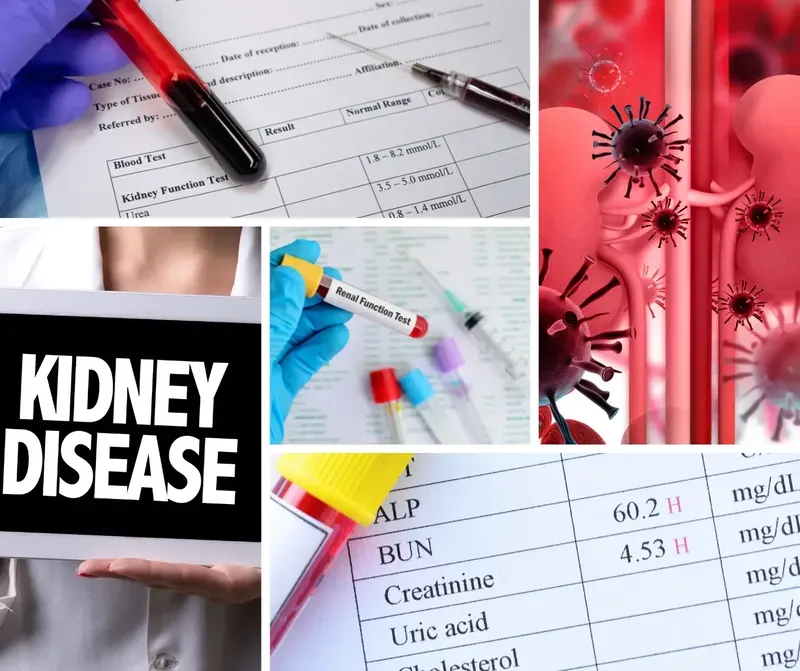
Diagnostics: Kidney function Test

Blood and urine tests are done to check kidney function.

Blood tests that can help assess kidney function include creatinine level, blood urea nitrogen level, and estimated glomerular filtration rate (eGFR).

Urine tests that can help assess kidney function include urine protein test, urine specific gravity test, and urine creatinine test.

What tests are done to check kidney function?

The most common tests to check kidney function are a blood test called creatinine and a urine test called albumin.

Creatinine is a waste product that is released into the blood when the muscle is damaged. So if the kidneys are not working properly, creatinine levels will go up. Albumin is a protein that is found in the urine. If the kidneys are not working properly, more albumin will leak out of the kidneys and into the urine.

Other tests that may be done to check kidney function include:

-A blood test to measure creatinine clearance. This measures how well the kidneys are filtering creatinine from the blood.

-A urine test to measure protein levels. High protein levels

When a doctor checks kidney function, they will order a blood test to check creatinine levels and blood urea nitrogen levels. These tests give an indication of how well the kidneys are working. If the creatinine or BUN levels are high, it means that the kidneys are not working properly. The doctor may also order a urine test to look for albumin in the urine. Albumin is a protein that is normally filtered out by the kidneys. If there is albumin in the urine, it means that the kidneys are not working properly.

What is the most accurate test for kidney function?

The most accurate test for kidney function is a creatinine blood test. It measures the level of creatinine in your blood. Creatinine is a waste product that is released when muscle tissue is damaged. So the higher your creatinine level, the more damage your kidneys have sustained.

Other tests that can be used to measure kidney function include a BUN (blood urea nitrogen) test and urine analysis. However, both tests are less accurate than the creatinine blood test.

What is a normal kidney function level?

Normal kidney function is when the kidneys filter wastes and excess fluid from the blood to make urine. The normal range for creatinine, a waste product that is filtered out by the kidneys, is 0.5 to 1.1 mg/dL for women and 0.6 to 1.2 mg/dL for men. Urine output should be about 600 to 800 mL per day. If you have symptoms such as foamy urine, swelling in your legs, shortness of breath, or chest pain, see your doctor right away because they may be signs of a problem with your kidneys.

Normal kidney function is defined as a creatinine level below 1.5 mg/dL in men and below 1.4 mg/dL in women. Creatinine is a waste product that is eliminated from the body through the kidneys. When the kidneys are functioning properly, they filter creatinine and other waste products from the blood and excrete them in urine. A creatinine level that is higher than normal indicates that the kidneys are not filtering blood as efficiently as they should be. This can be a sign of many different diseases or conditions, including kidney disease, liver disease, heart failure, and diabetes.

What are the first signs of kidney disease?

The first signs of kidney disease are usually subtle and can be easily missed. Here are five common early signs of kidney disease:

1) Changes in urine output, such as a decrease in the amount of urine produced or an increase in the amount of time needed to produce a full bladder

2) Increased thirst and urination, caused by the body's efforts to get rid of excess fluid by increasing urine production

3) Foamy or bubbly urine, a sign that protein is spilling over into the urine from damaged kidneys

4) Swelling in feet, ankles, and legs, caused by buildup of fluid called edema

5) Feeling tired and sluggish all the time, possibly due to anemia

Can a blood test detect kidney problems?

Yes. A blood test can detect kidney problems by looking for biomarkers in the blood that indicate a problem with the kidneys.

Some common biomarkers that may be detected in a blood test include creatinine, urea nitrogen, and albumin. If any of these biomarkers are elevated, it may indicate that there is a problem with the kidneys.

Kidney problems can be detected through blood tests, although the specific tests used will vary depending on the nature of the kidney problem.

Some common blood tests used to detect kidney problems include:

-A creatinine level, which measures how well your kidneys are filtering waste products from your blood

-A BUN level, which measures how much urea (a breakdown product of protein) is in your blood

-An albumin level, which measures how much albumin (a type of protein) is in your urine

-A creatinine clearance test, which measures how much creatinine is cleared from your blood per minute

Read Blog
Monthly Health Survey via SecondMedic App: A Smarter Approach to Preventive Healthcare

Monthly Health Survey via SecondMedic App: A Smarter Approach to Preventive Healthcare

Healthcare is gradually shifting from reactive treatment to proactive prevention. Traditional health models rely heavily on annual checkups or medical visits only after symptoms become severe. However, many chronic and lifestyle-related conditions develop silently over time. The Monthly Health Survey via the SecondMedic App addresses this gap by enabling continuous health monitoring and early risk identification.

According to the Indian Council of Medical Research (ICMR) and NITI Aayog, early detection and preventive care are critical to reducing the growing burden of non-communicable diseases in India. Digital health tools play a key role in achieving this shift.

What Is the Monthly Health Survey?

The Monthly Health Survey is a structured digital questionnaire delivered through the SecondMedic App. It captures key health indicators such as:

  • recurring symptoms
     

  • lifestyle habits
     

  • stress and sleep patterns
     

  • nutrition and activity levels
     

  • chronic condition markers
     

By repeating the survey monthly, subtle health trends become visible.


Why Monthly Health Tracking Matters

Annual Checkups Miss Gradual Changes

Many health issues develop slowly. Annual tests may appear normal while symptoms quietly progress between visits.

Monthly surveys:

  • detect early warning signs
     

  • capture symptom patterns
     

  • identify lifestyle-related risks


Health Is Dynamic, Not Static

Stress, sleep, diet and activity fluctuate monthly. Regular tracking reflects real-life health variation more accurately than isolated tests.


How the Monthly Health Survey Works

Each month, users answer a guided set of questions related to:

  • physical symptoms
     

  • mental wellbeing
     

  • lifestyle behaviours
     

  • known medical conditions
     

The app analyses responses to highlight:

  • risk trends
     

  • symptom persistence
     

  • areas needing attention
     

This structured approach simplifies health awareness.


Key Health Areas Covered

Symptom Monitoring

Persistent fatigue, headaches, breathlessness or digestive issues are tracked across months to identify patterns.


Lifestyle Risk Factors

The survey captures:

  • sedentary behaviour
     

  • sleep quality
     

  • stress levels
     

  • dietary habits
     

These factors strongly influence long-term health outcomes.


Chronic Disease Indicators

For individuals with diabetes, hypertension or thyroid conditions, monthly monitoring supports better disease control and early escalation.


Role in Preventive Healthcare

Preventive healthcare focuses on stopping disease before complications arise.

Monthly health surveys support prevention by:

  • identifying risks early
     

  • prompting timely consultations
     

  • supporting lifestyle modification
     

  • reducing emergency care needs
     

WHO and NITI Aayog both highlight digital monitoring as a cornerstone of preventive health systems.


Benefits for Individuals

Early Awareness

Users become aware of health changes before symptoms become severe.


Empowered Decision-Making

Access to regular health insights encourages proactive lifestyle choices.


Reduced Anxiety

Structured tracking reduces uncertainty and fear about unexplained symptoms.


Better Doctor Consultations

Survey data provides doctors with a clearer health history, improving consultation quality.


Benefits for Chronic Care Management

For chronic conditions, consistency is key.

Monthly surveys help:

  • track symptom control
     

  • identify early deterioration
     

  • support medication adherence
     

  • reduce complications
     

This continuous loop improves long-term outcomes.


Data-Driven Personalised Care

The survey supports personalised care by:

  • tailoring recommendations
     

  • prioritising high-risk users
     

  • guiding preventive interventions
     

This approach moves healthcare from generic advice to individualised guidance.


Privacy and Responsible Use

Health data is sensitive.

The survey framework is designed to:

  • collect only relevant information
     

  • support medical decision-making
     

  • maintain confidentiality
     

Responsible data use builds trust and long-term engagement.


Why Digital Surveys Are Effective in India

India’s healthcare challenges include:

  • large population
     

  • limited access to preventive care
     

  • high lifestyle disease burden
     

Digital surveys overcome barriers by:

  • being accessible anywhere
     

  • requiring minimal time
     

  • enabling large-scale preventive monitoring
     

This scalability makes them highly impactful.


Integration with Broader Health Ecosystems

Monthly health surveys work best when integrated with:

  • medical consultations
     

  • diagnostic services
     

  • preventive checkups
     

  • digital health records
     

Integration ensures continuity of care.


Long-Term Impact on Healthcare Outcomes

Over time, regular health tracking leads to:

  • earlier diagnoses
     

  • reduced hospitalisations
     

  • better chronic disease control
     

  • lower healthcare costs
     

  • improved quality of life
     

Lancet studies show that continuous monitoring significantly improves preventive outcomes.


Who Should Use a Monthly Health Survey?

  • adults over 30
     

  • individuals with chronic conditions
     

  • people with high-stress lifestyles
     

  • those focusing on preventive health
     

  • corporate wellness participants
     

Proactive monitoring benefits all age groups.


Conclusion

The Monthly Health Survey via the SecondMedic App represents a modern, preventive approach to healthcare. By capturing health trends regularly rather than annually, it empowers individuals to act early, supports doctors with better insights and reduces the burden of advanced disease. In an era where prevention is the most effective medicine, monthly health surveys transform awareness into action and data into healthier lives.


References

  • Indian Council of Medical Research (ICMR) – Preventive Healthcare and Early Detection Report

  •  NITI Aayog – Digital Health and Preventive Care Strateg

  •  World Health Organization (WHO) – Digital Health Monitoring Guideline

  •  Lancet – Preventive Healthcare and Continuous Monitoring Studies

  • National Health Authority – Digital Health Mission Indi

  •  Statista – Digital Health App Adoption Trends India

See all

Live Doctor consultation
Live Doctor Chat

Download Our App & Get Consultation from anywhere.

App Download
call icon for mobile number calling and whatsapp at secondmedic